// Platform preview
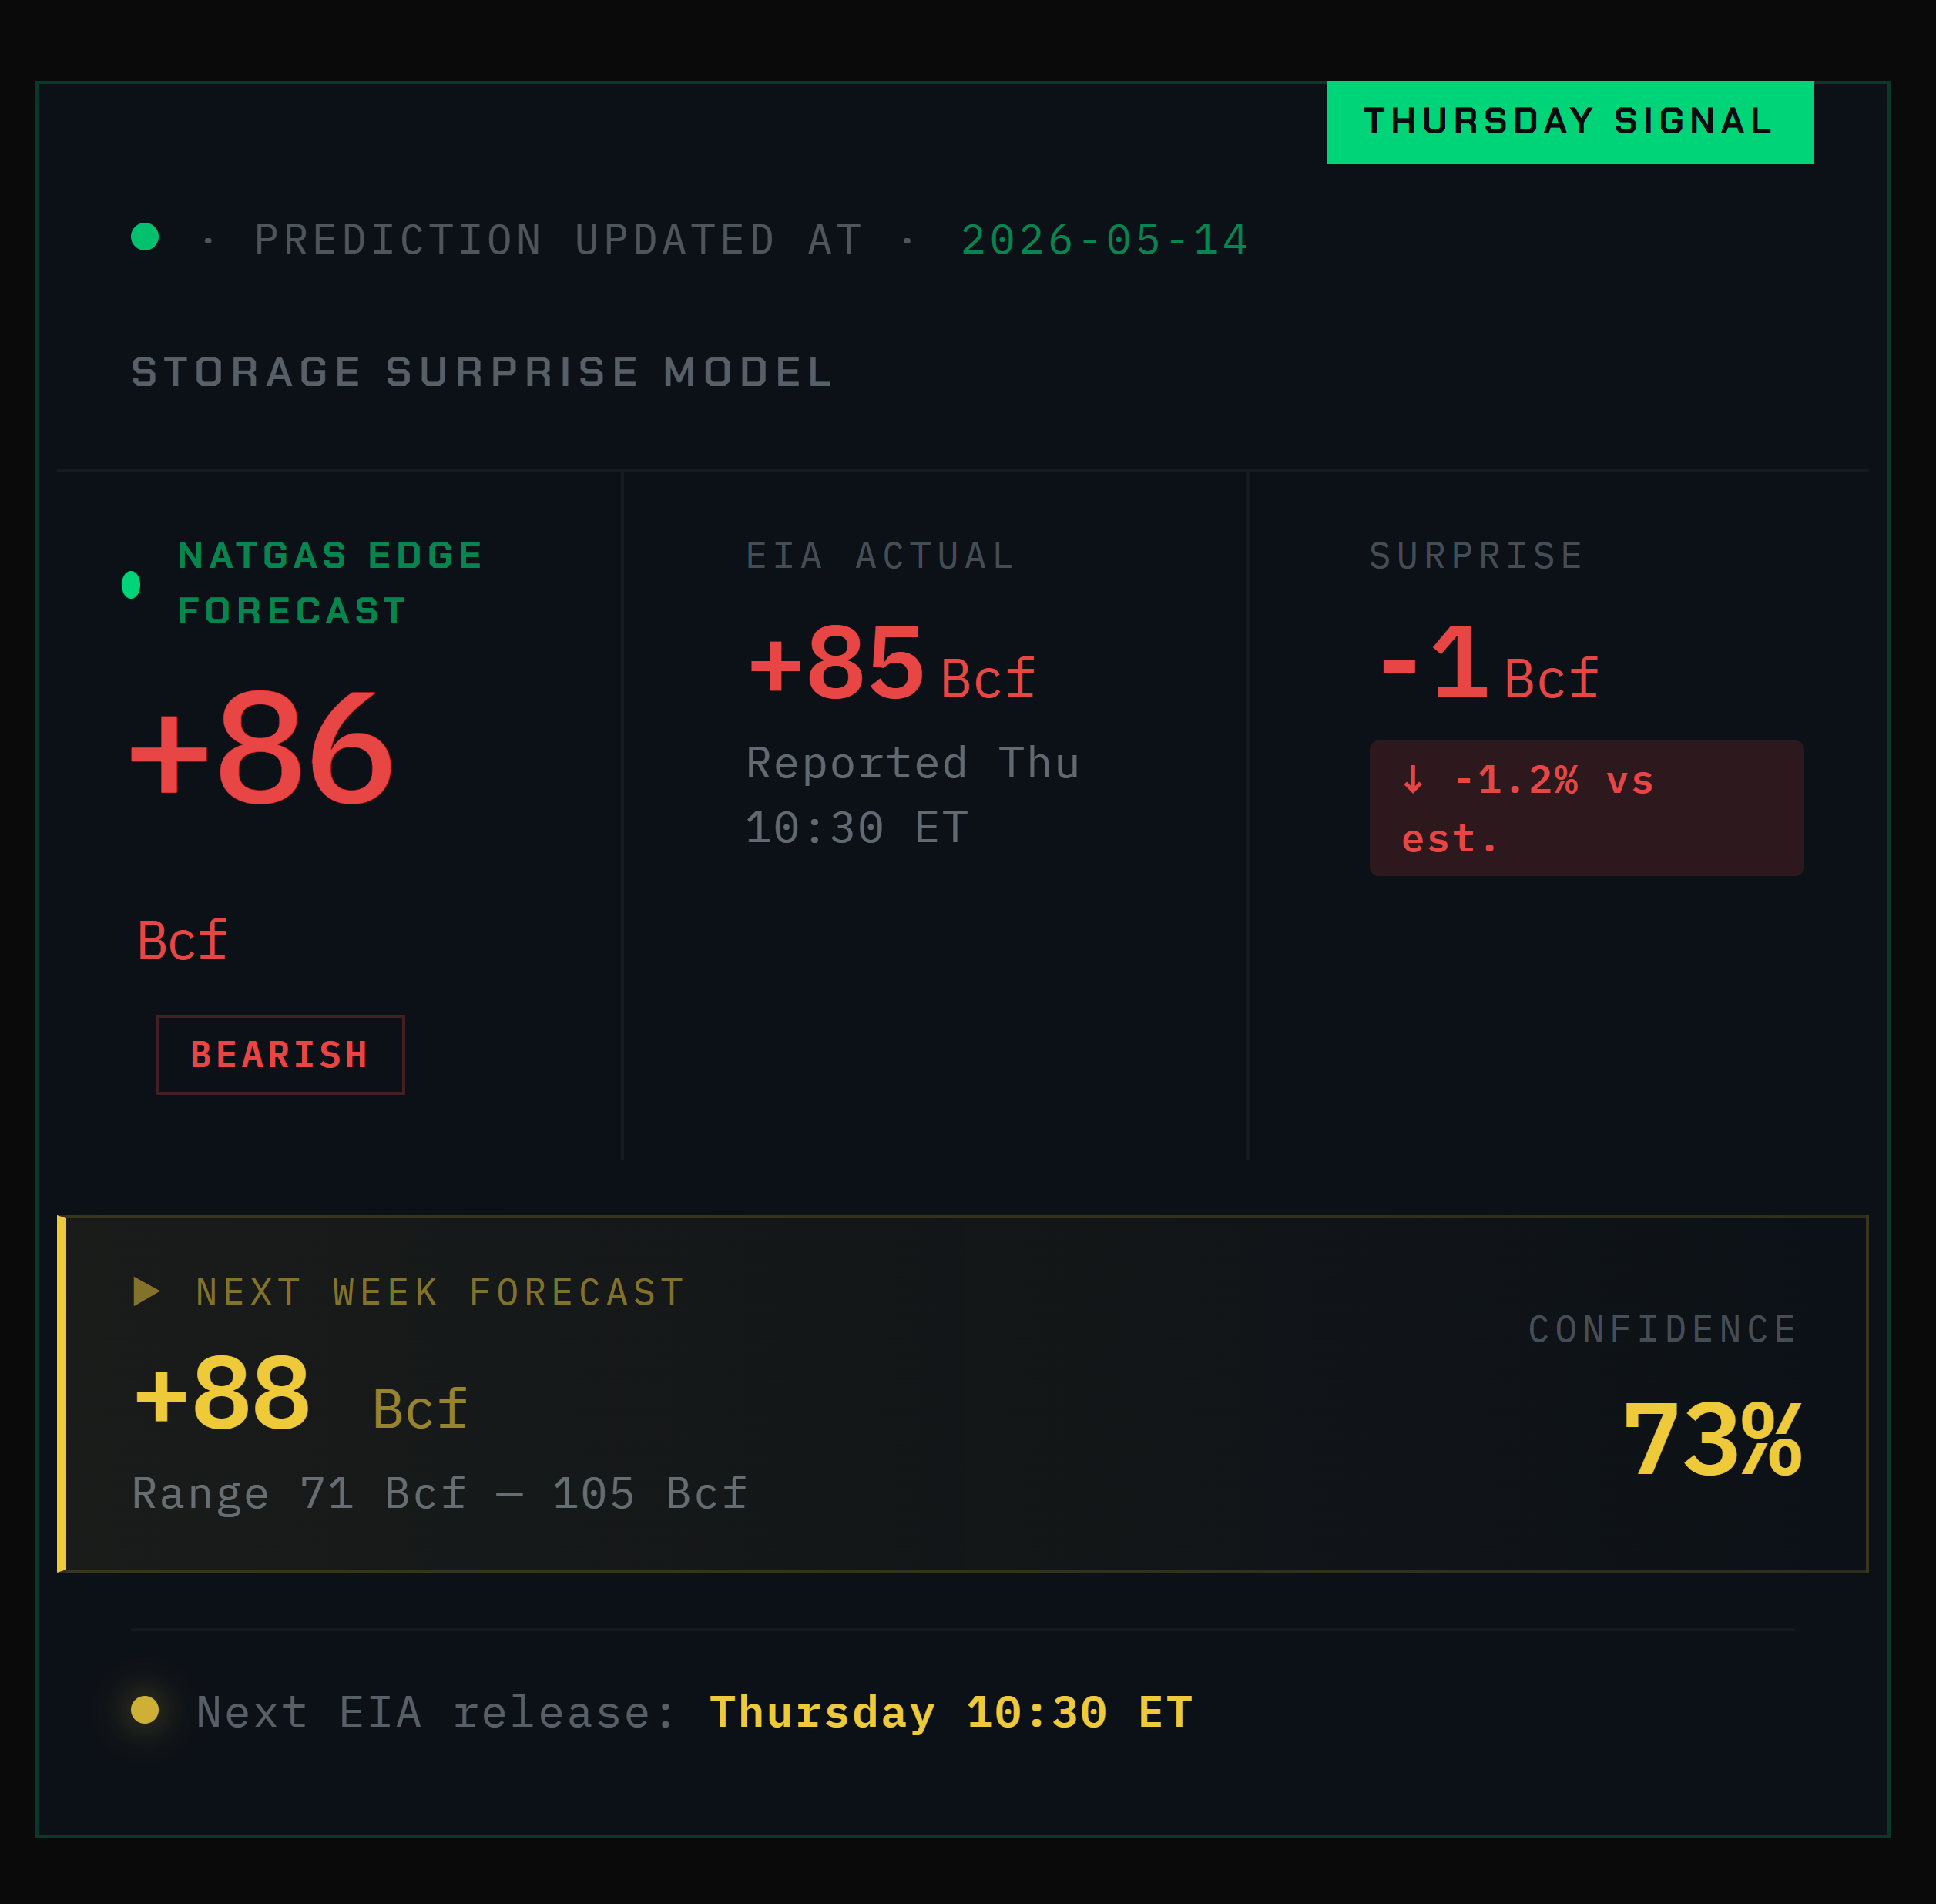
Storage surprise model
Thursday's number,
seven days early.
EIA week-on-week storage change forecast, published seven days before the official release. 18 Bcf mean absolute error across 156 live weeks — comparable to the Reuters and Bloomberg analyst consensus, delivered seven days ahead of the published analyst consensus.
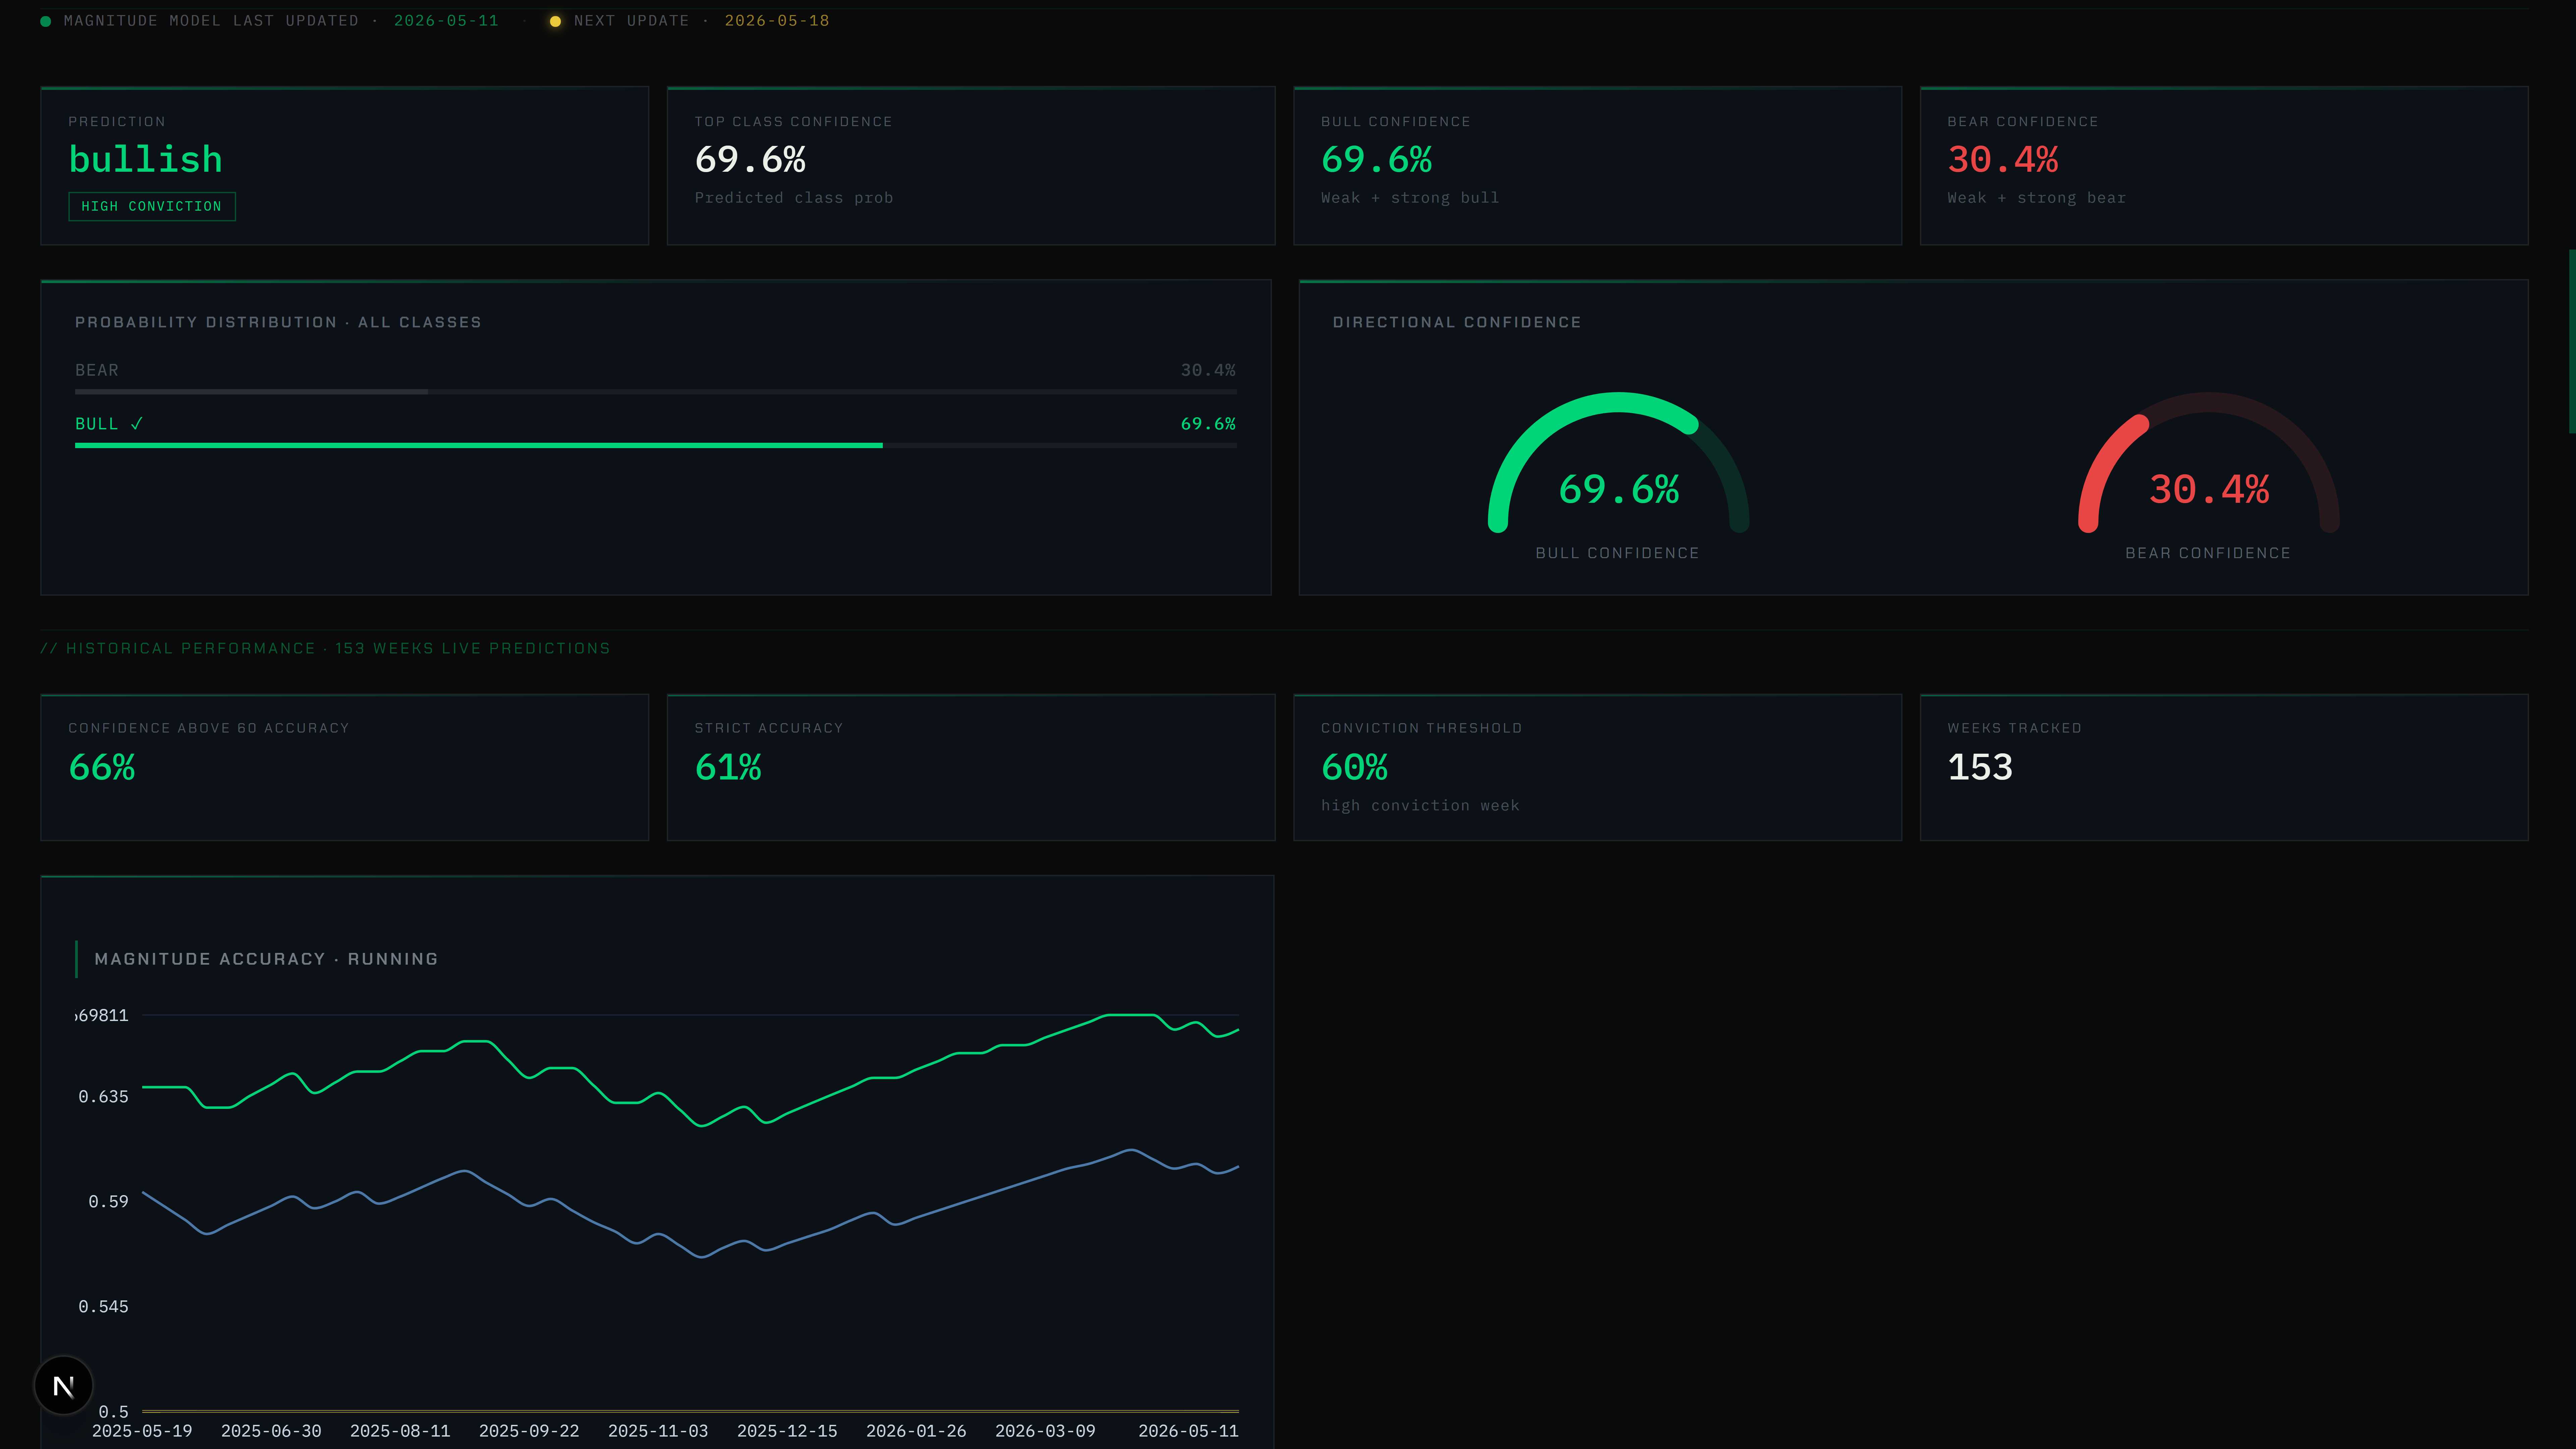
Directional model
62% accuracy.
Three years live.
Weekly directional forecast with probability distributions. 62% strict accuracy across 156 walk-forward out-of-sample weeks, rising to 67% on the high-conviction subset (~36 weeks per year). Trained on the full nine-fundamental feature set, validated walk-forward, never fitted to data it later predicted.
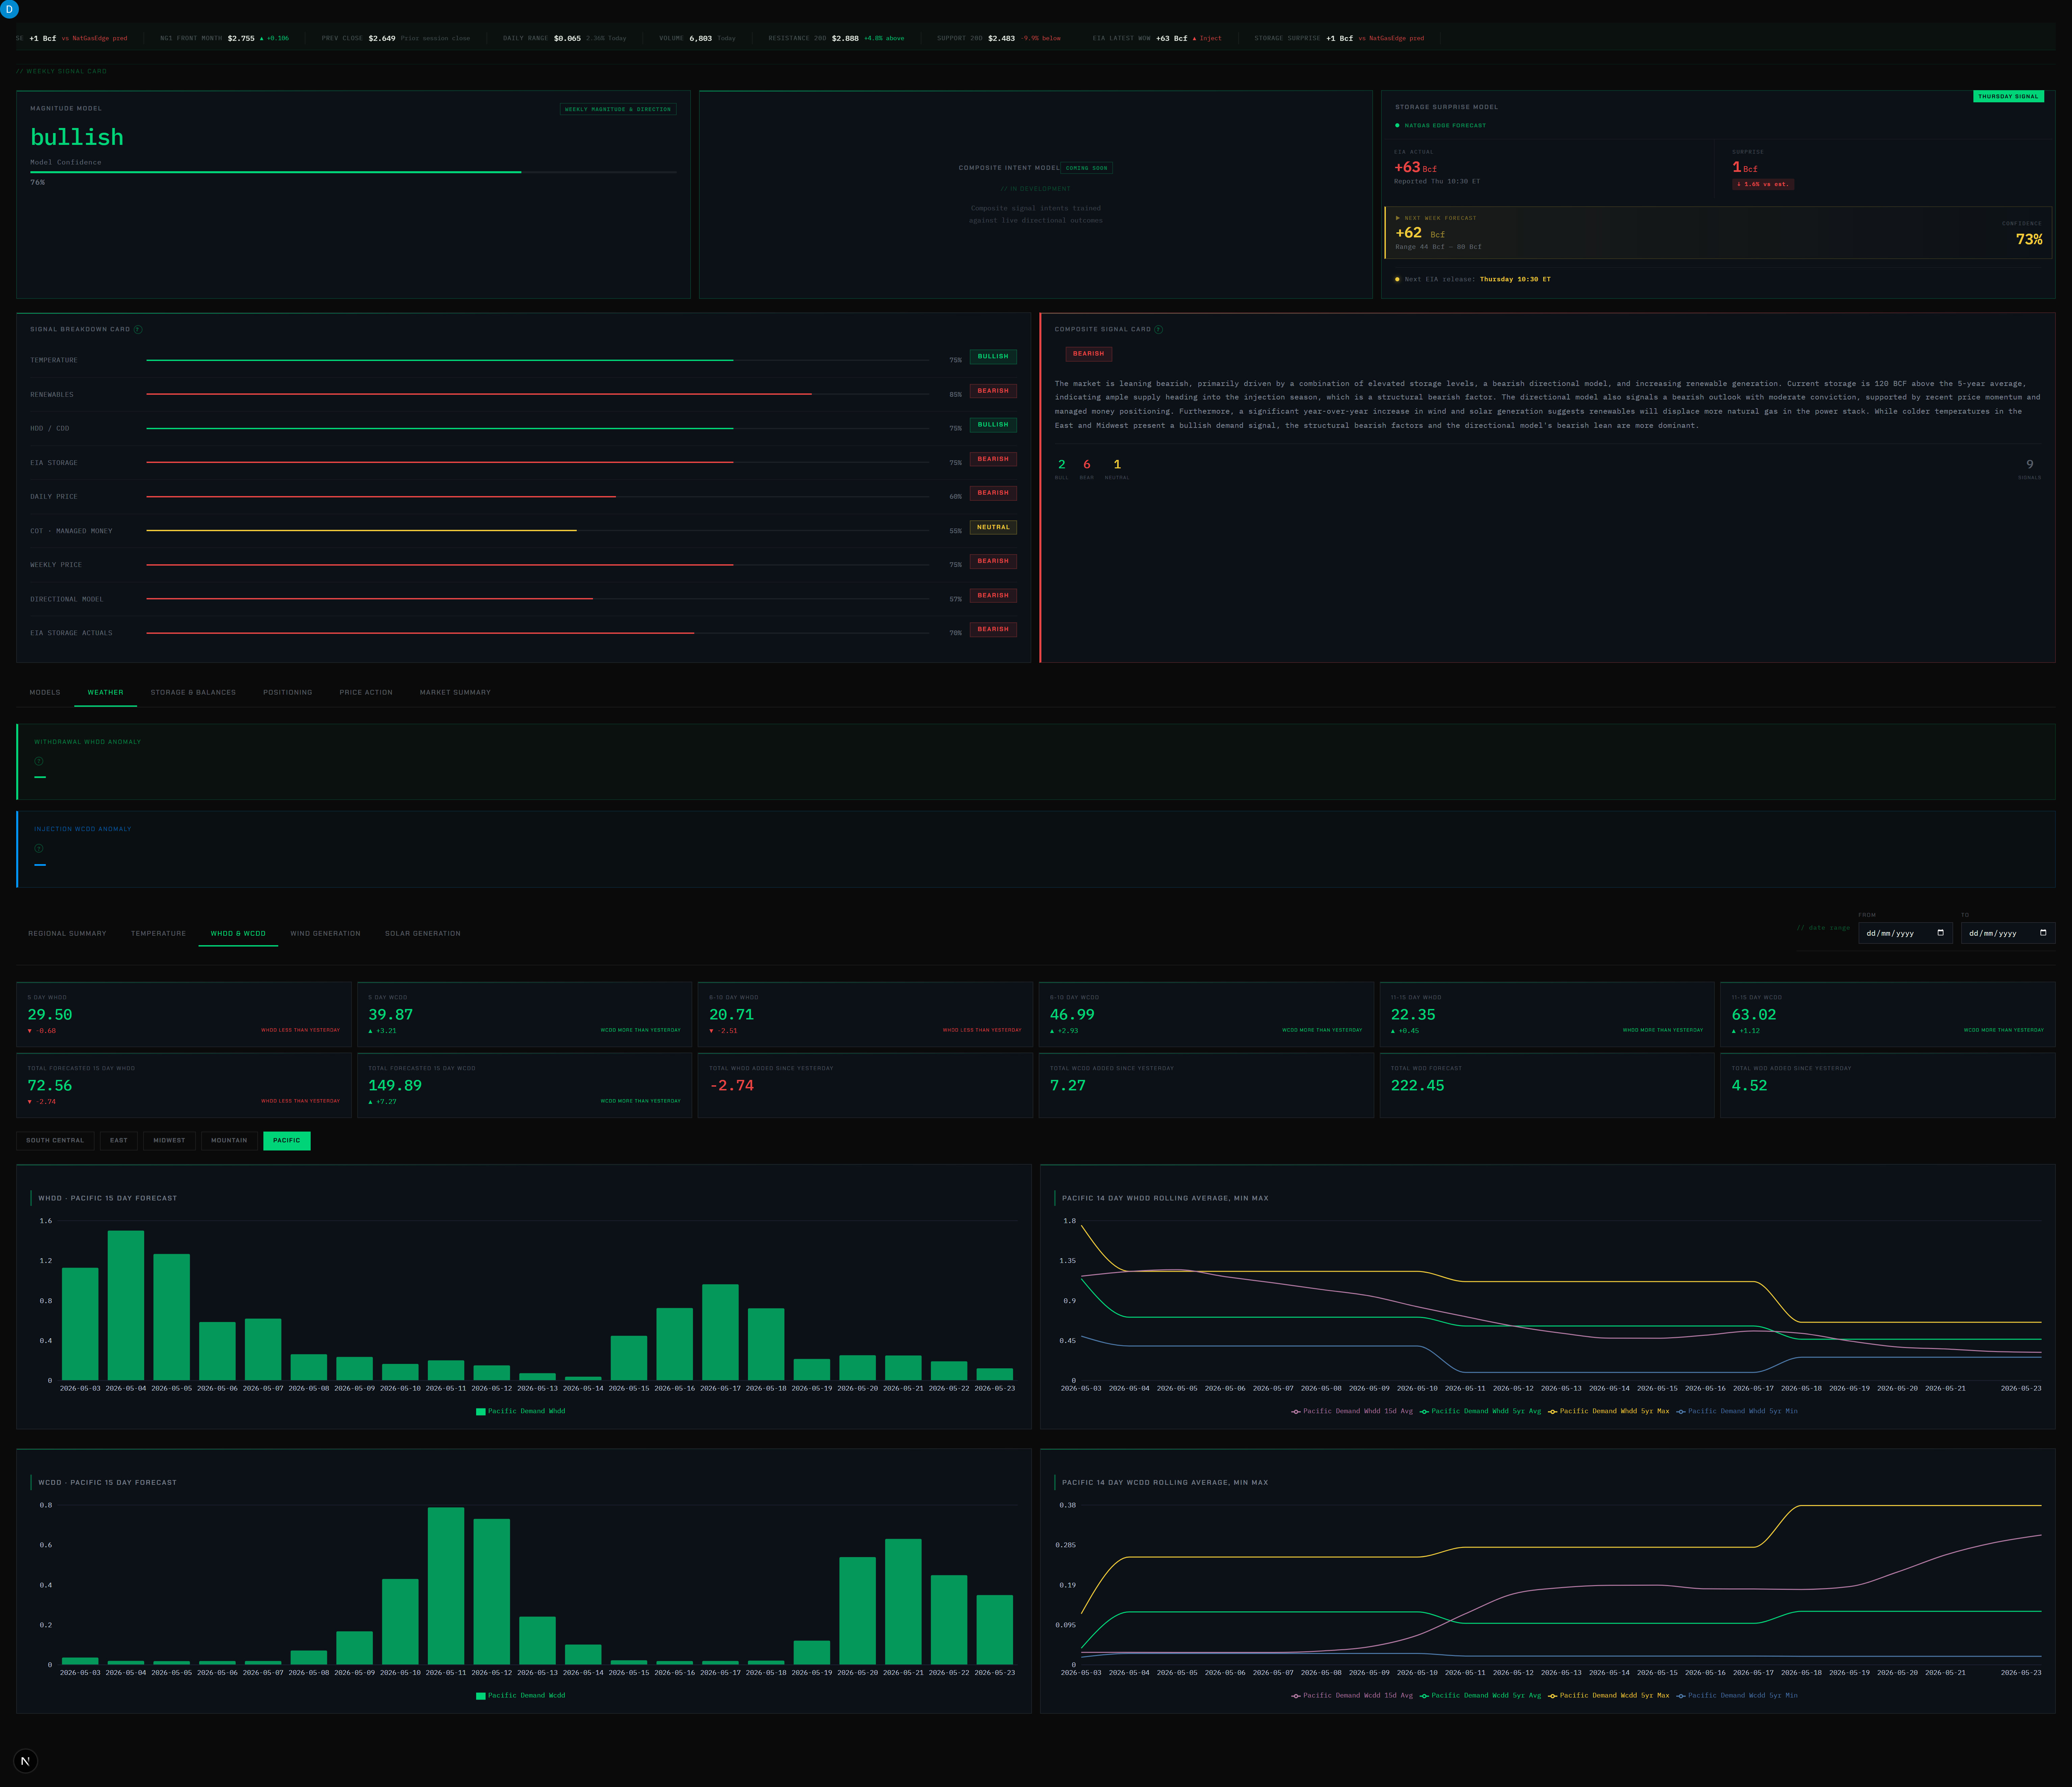
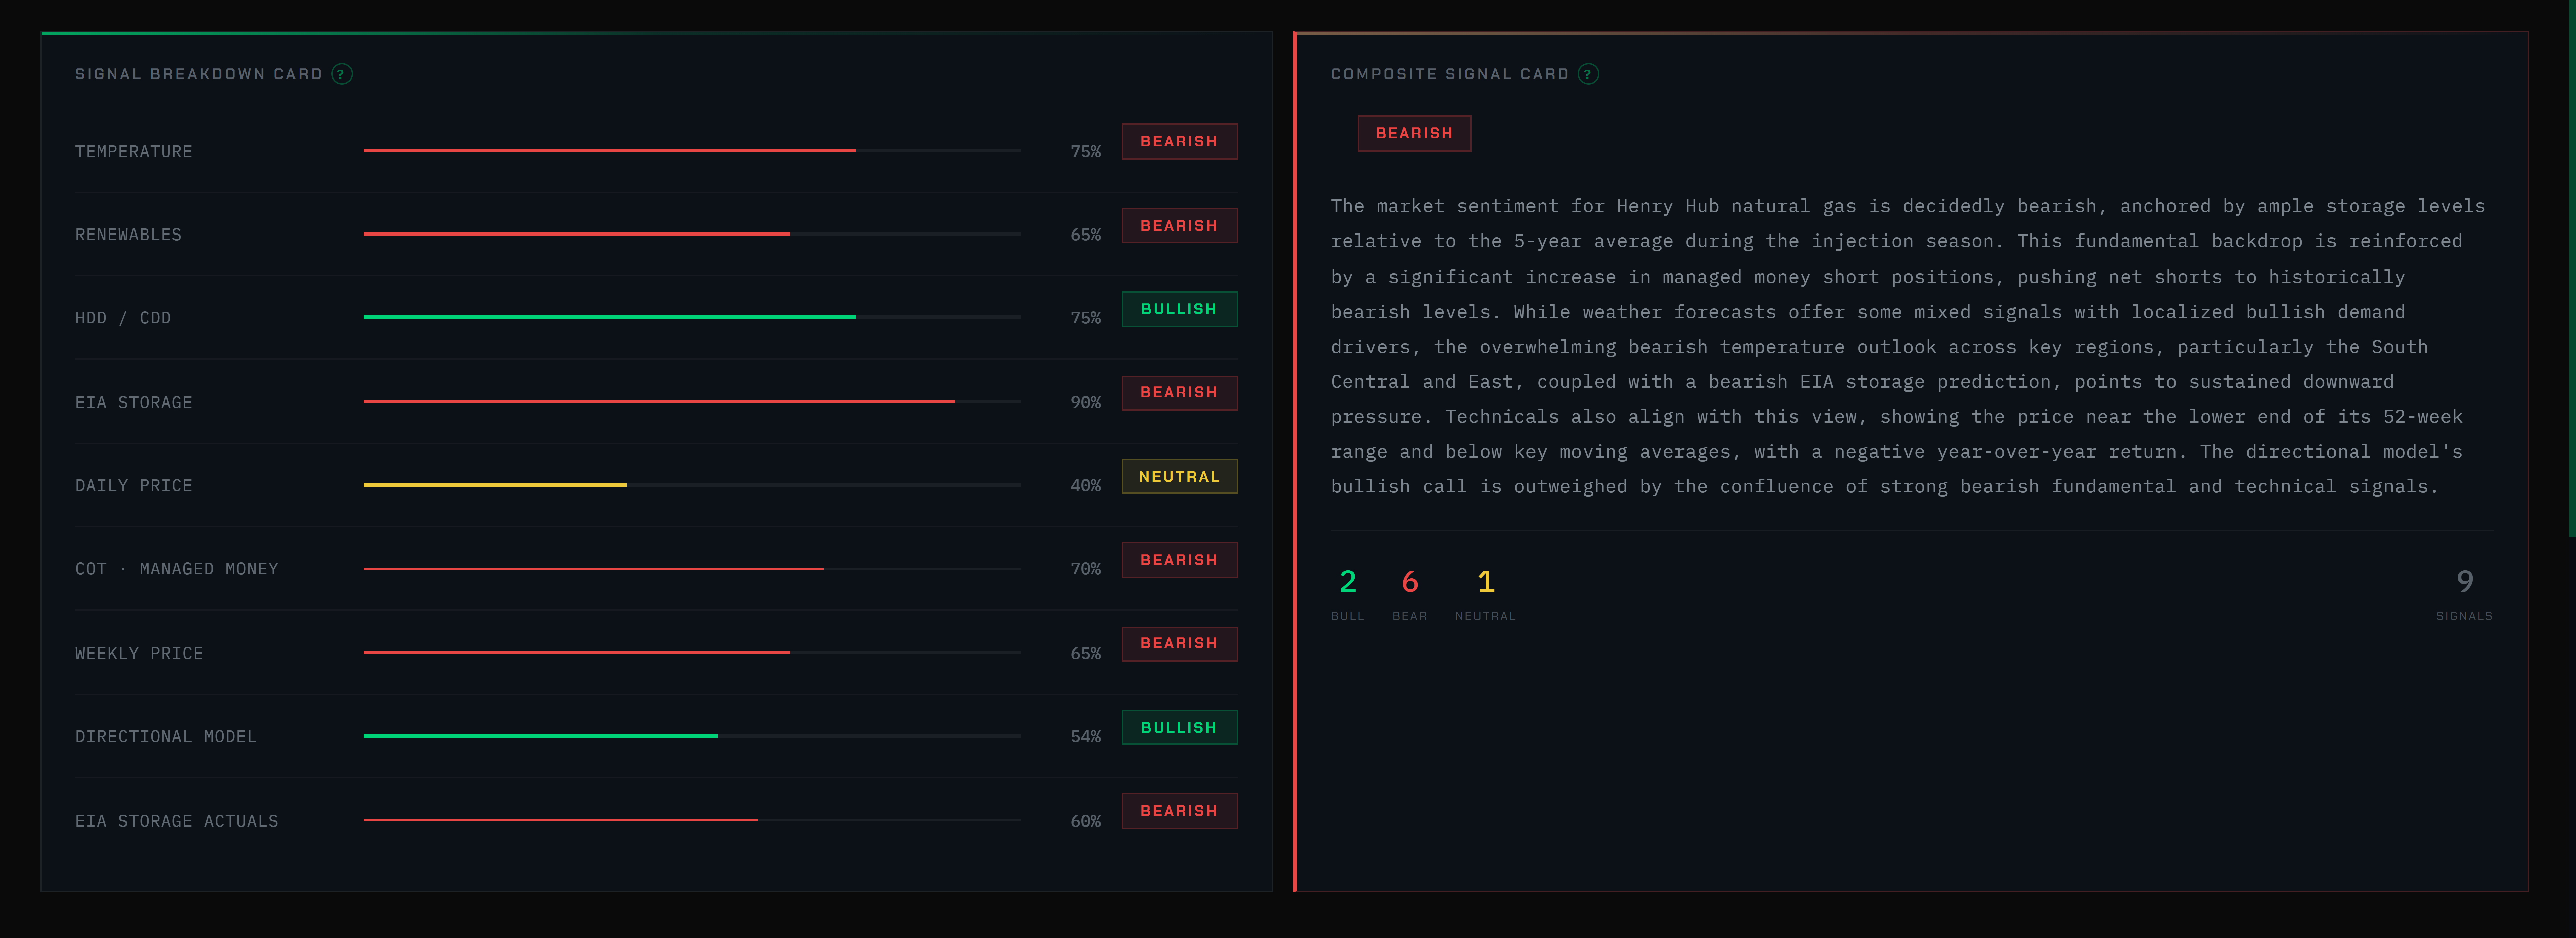
Composite signal view
Nine signals.
One synthesis.
Every fundamental scored bullish, bearish, or neutral with a written justification grounded in the actual pipeline output. The composite reads all nine and produces a single weekly verdict with reasoning. The synthesis layer that turns data into a view.
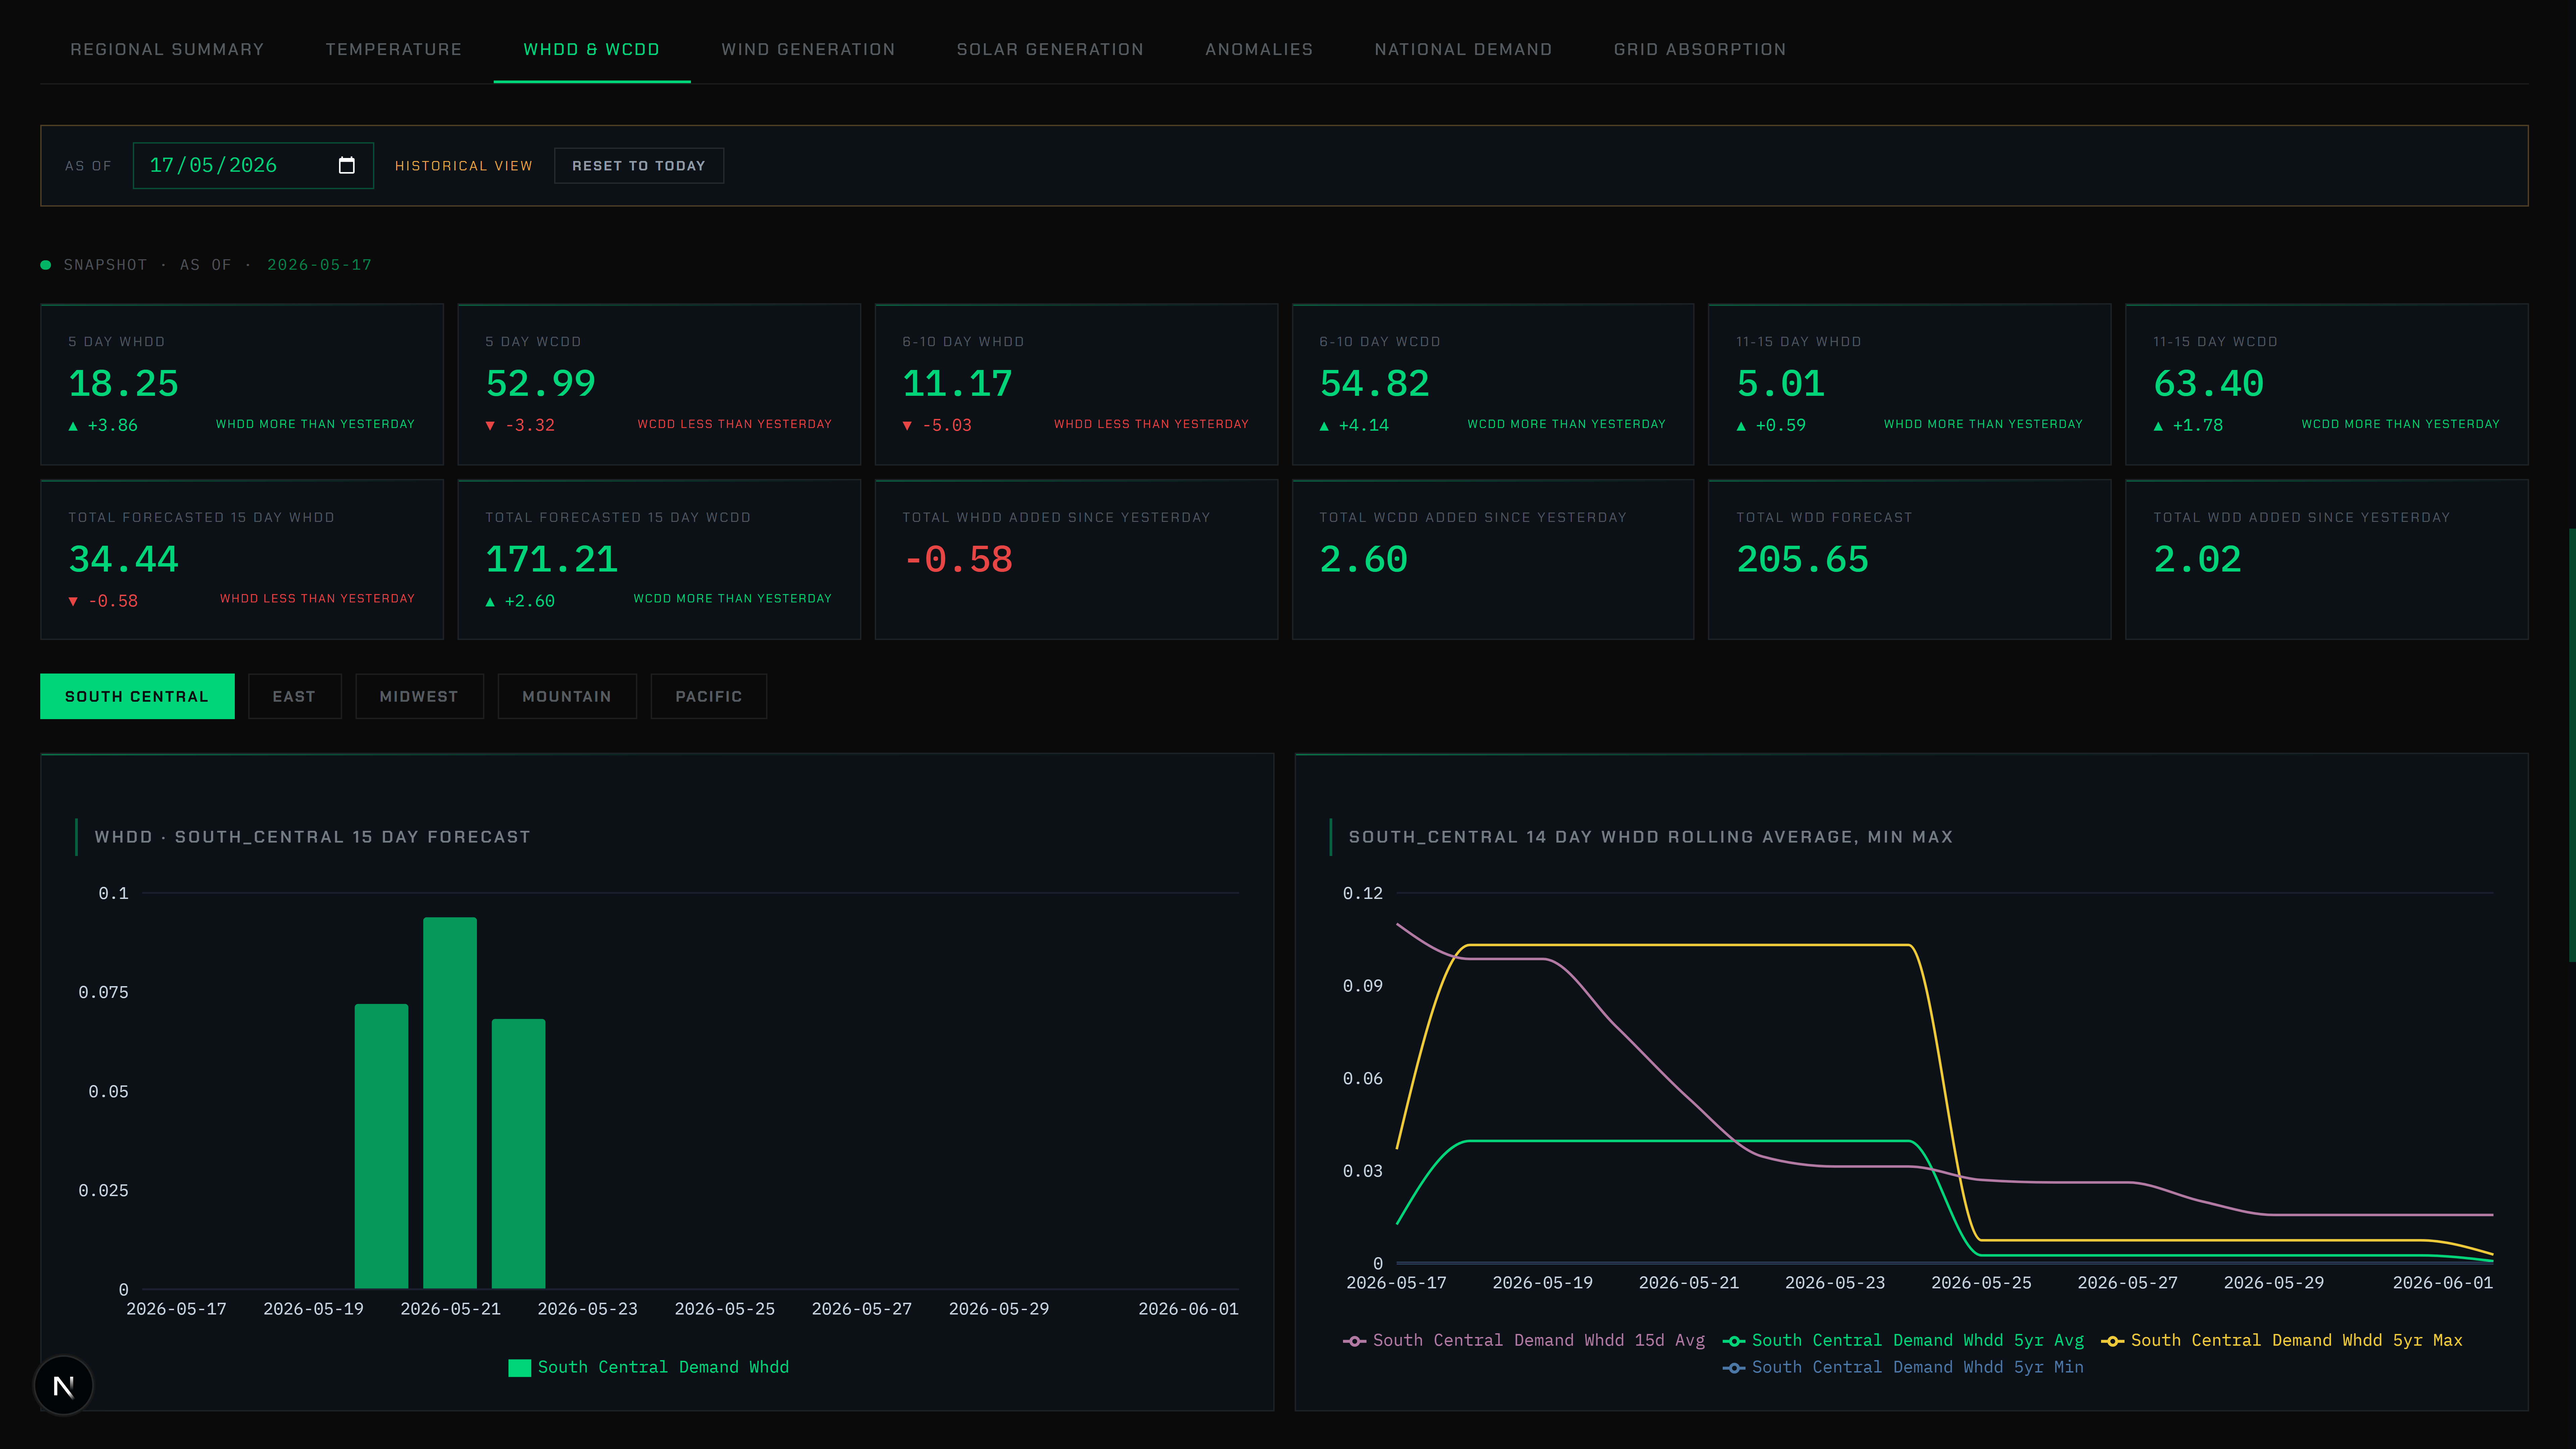
Weather and renewables
What actually
moves gas.
Regional HDD, CDD, mean temperature, wind generation, solar generation — each split across short-range, medium-range, and long-range forecast horizons. Displayed against rolling seasonal percentile bands across sixteen years. The features the directional model actually leans on most.
LNG feed gas
The bullish narrative,
quantified.
Daily feed gas volumes for the seven major US export terminals — Sabine Pass, Corpus Christi, Calcasieu Pass, Plaquemines, Cove Point, Cameron, and Elba — broken out per facility and aggregated to national flow. Each terminal displayed against its own seasonal norms with anomaly flags when daily flows diverge from typical operation. LNG demand is the structural bullish story in nat gas; this is what it looks like in numbers, not narrative.

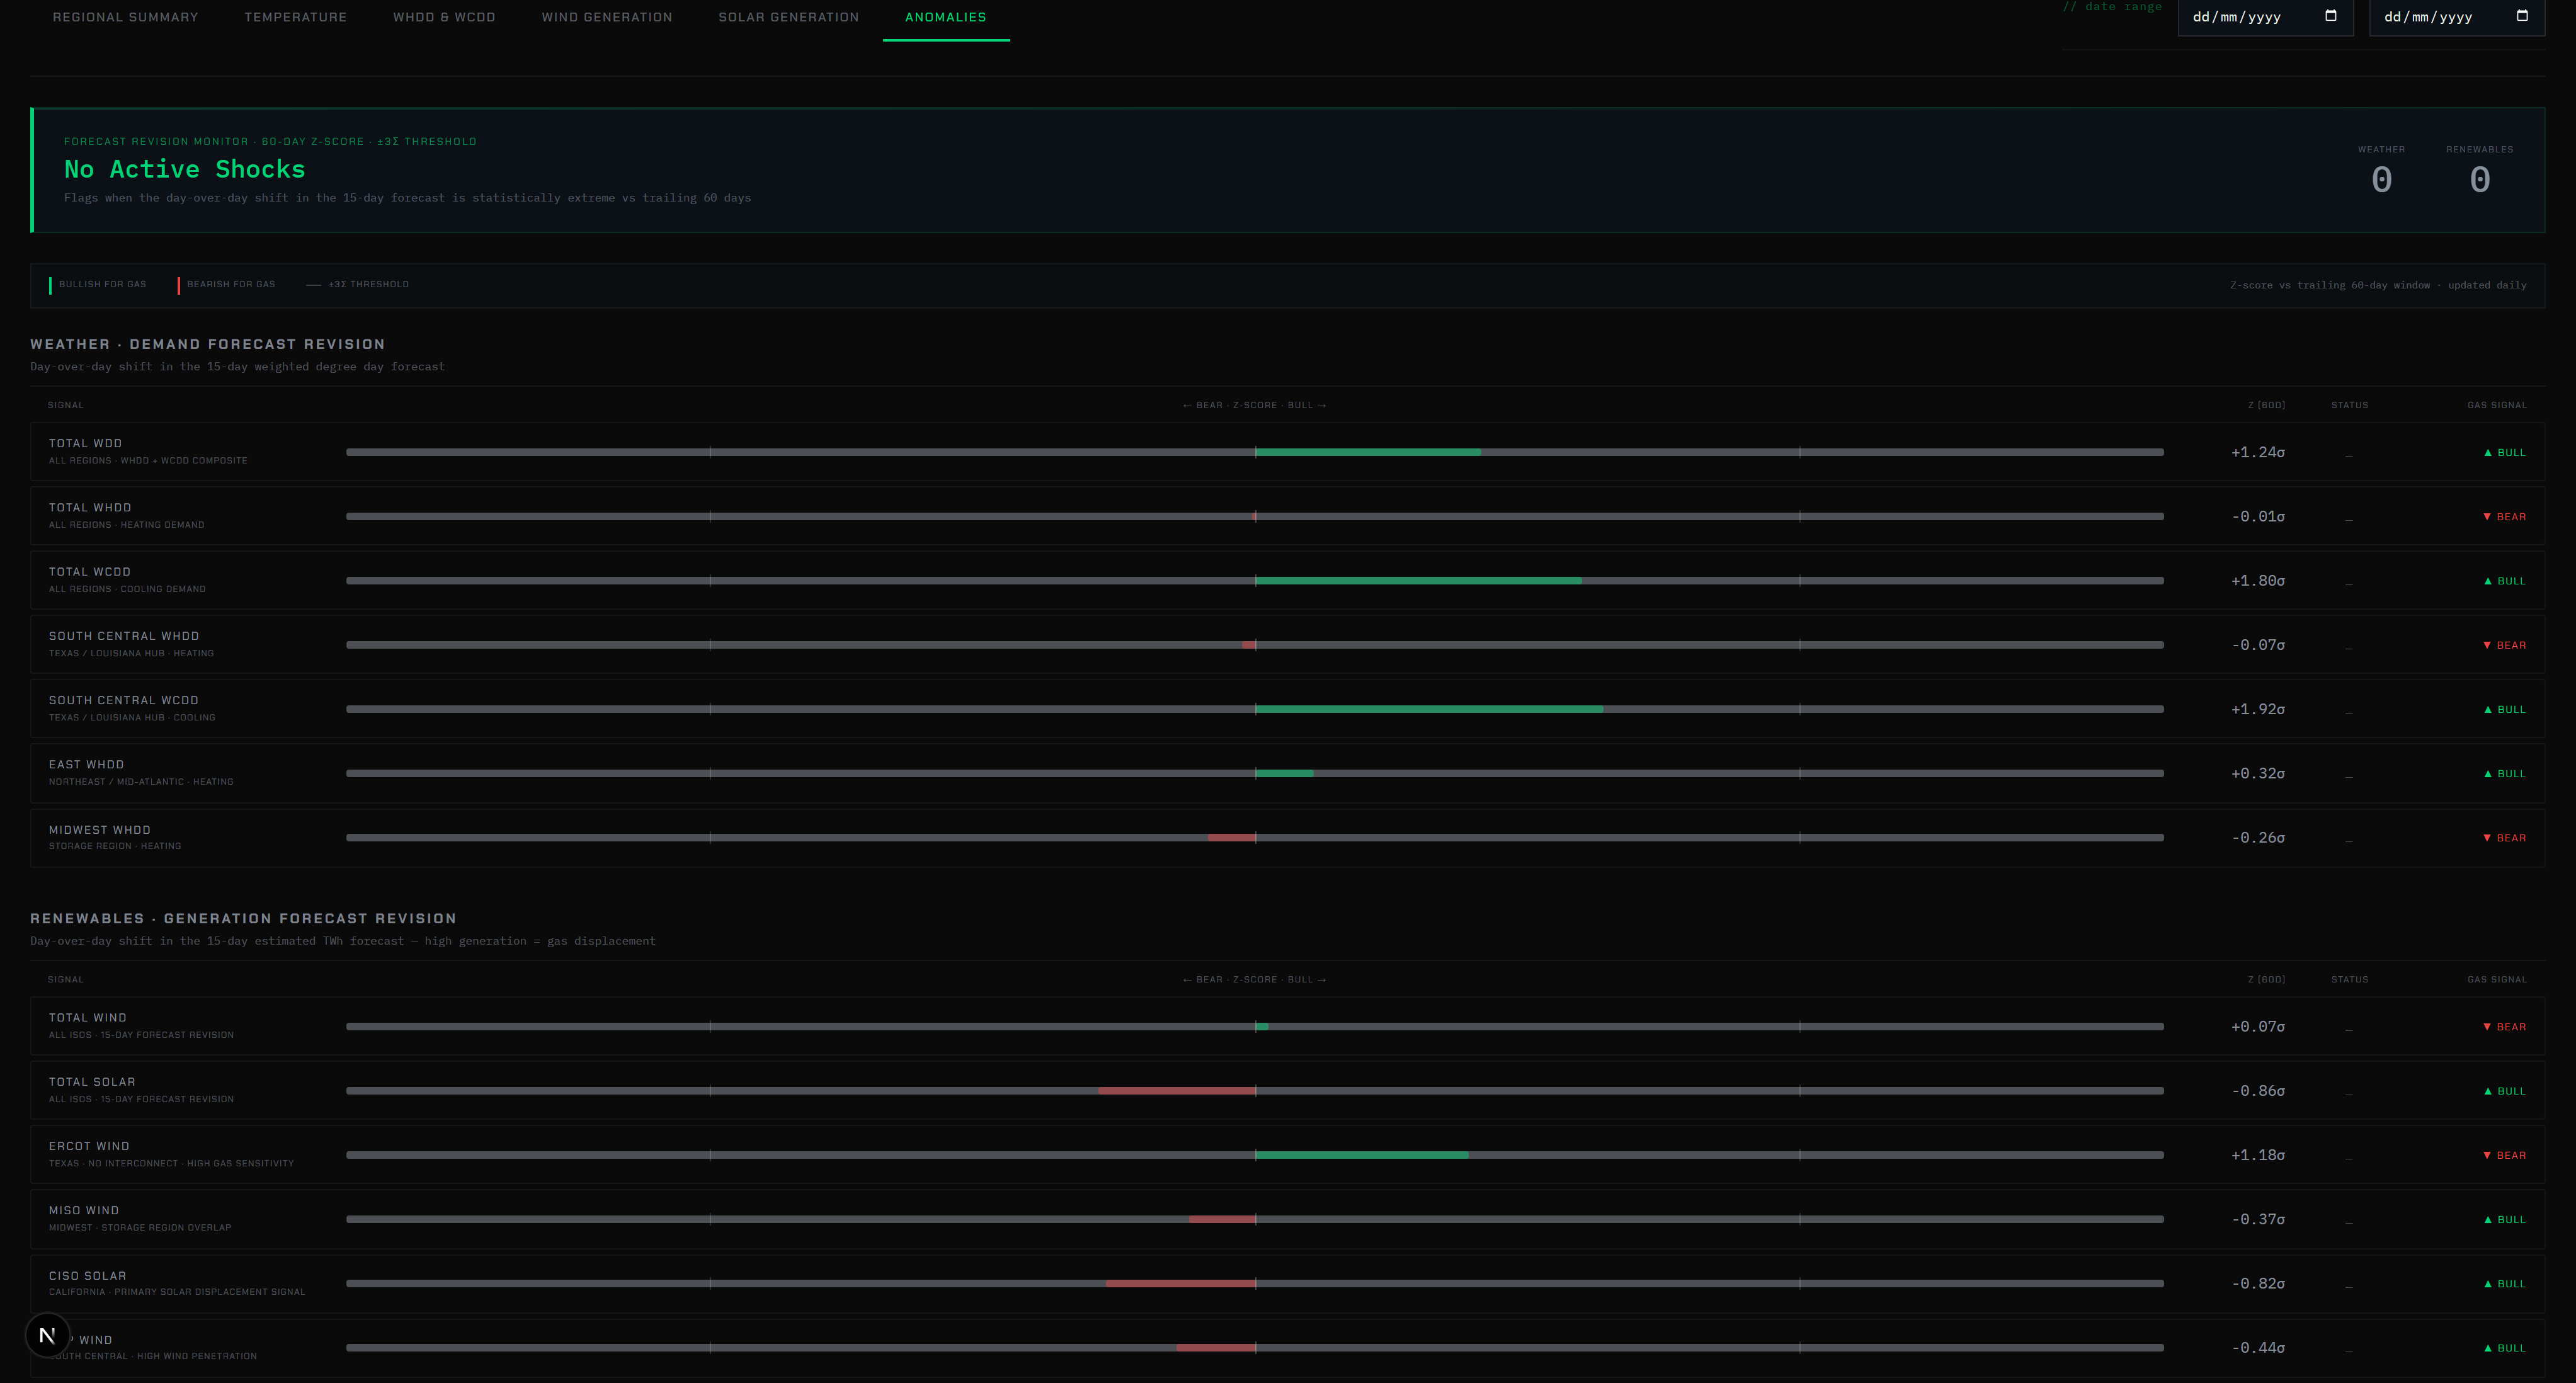
Anomalies · Active shocks & compound patterns
What's unusual
right now.
The Anomalies page consolidates every active forecast revision shock across the platform into one diagnostic view. Six tabs — Active, Weather, Renewables, Storage, Positioning, Price — each showing every z-score above the configurable threshold, with directional implications for gas marked bullish or bearish.
Beyond individual component shocks, the page surfaces compound patterns — multi-feature configurations measured against sixteen years of forward price data and only published when hit rate, mean return, and median return all beat baseline meaningfully on N≥30 historical instances. Each card displays the live trigger value alongside its measured historical context — what the configuration has done over the following ten days, every time it has fired since 2010.
An as-of date picker navigates the page back through history. Pick any date and the platform shows exactly what would have been visible that day — the same z-scores, the same shocks, the same compound flags. A time machine over the anomaly substrate.
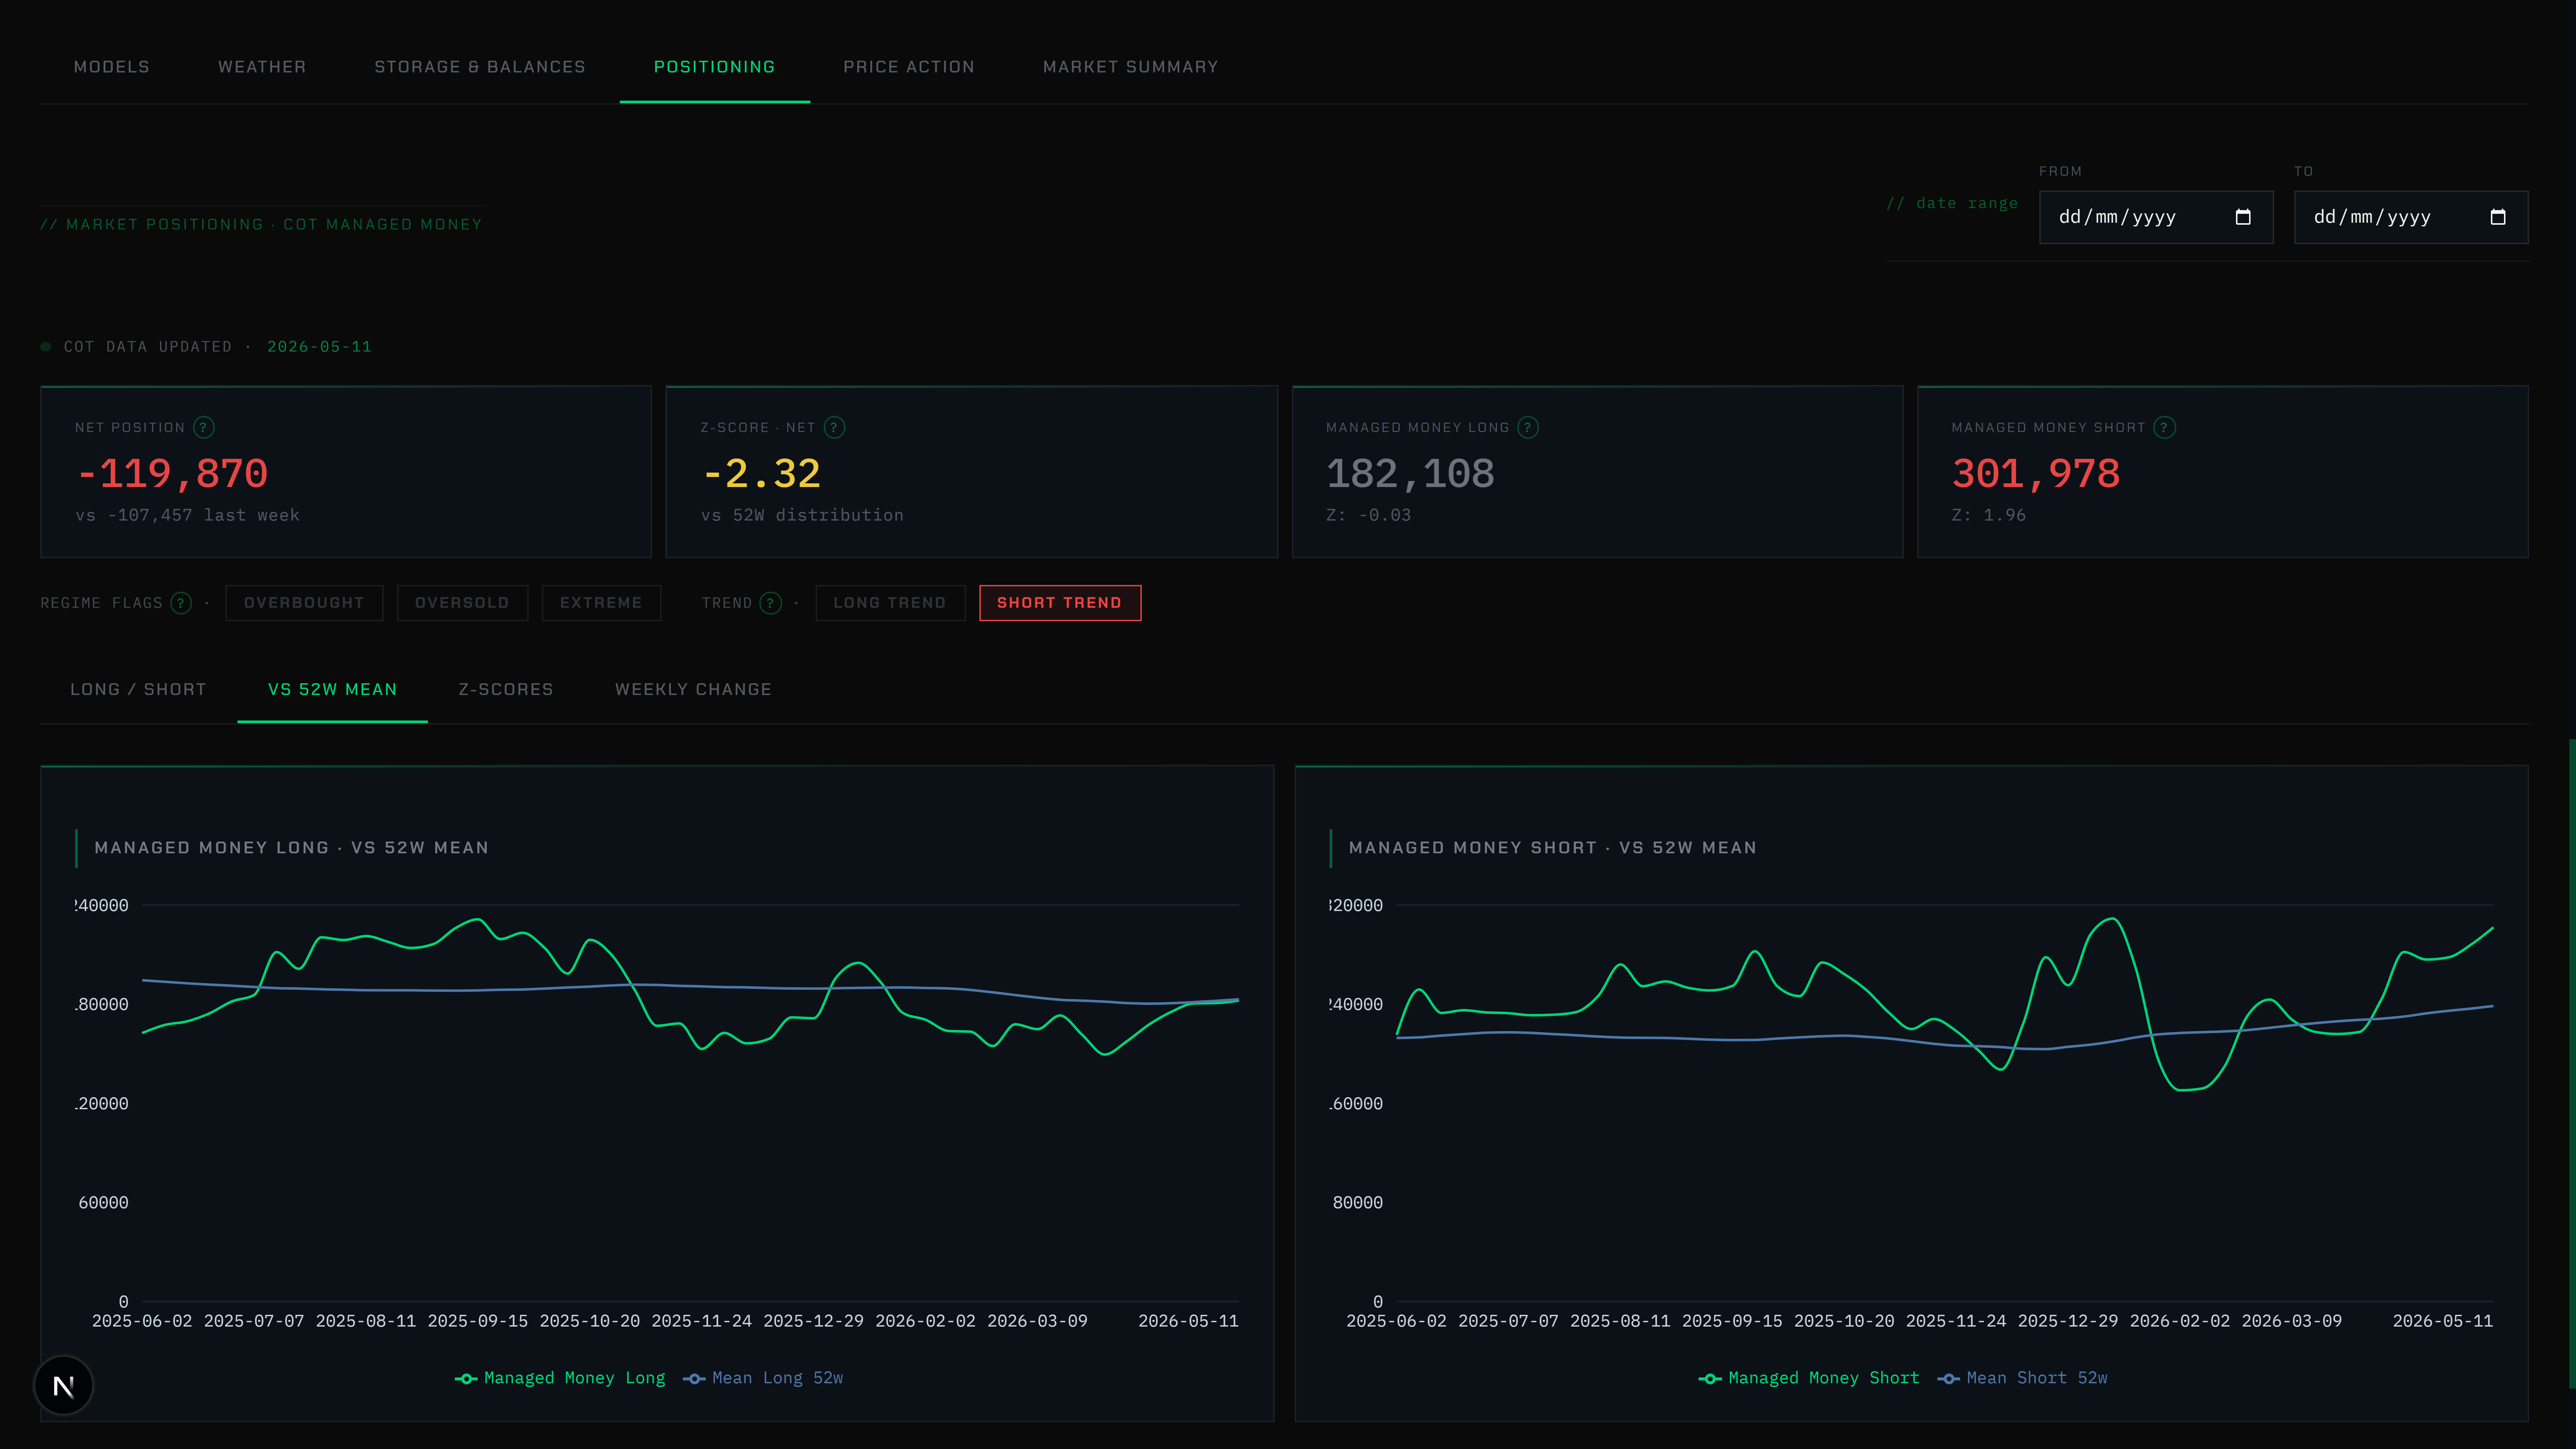
Managed money positioning
Where positioning
actually is.
CFTC Commitments of Traders tracked weekly across sixteen years. Managed money long, short, net position, weekly deltas — each z-scored against its own 52-week distribution. Regime flags surface when positioning is at historical extremes, not just where it sits in absolute terms.
User experience
Speed to insight,
not speed to chart.
Every fundamental, every signal, every track record — surfaced through one terminal. Nine signal cards render the week's verdict at a glance; the depth sits one click below. Date filters, seasonal overlays, percentile bands and z-scores are computed continuously, so the contextual analysis is already done by the time you log in.